Tutorial
This section describes how to use BETR-Research for global scale calculations of semi-volatile organic chemical fate and transport. Here, the reimplementation of BETR-Global is utilized. This section does not describe how to create new models or change the BETR-Global parametrization. However, after working through this tutorial, it should be obvious how to do that. For questions or if you encounter problems do not hesitate to contact me.
Download & Installation
Make sure you have the necessary software dependencies installed.
Do one of the following:
Download the latest release here and unpack it into a directory of your choice, for example “~/betrs”:
tar zxvf betrs.tar.gz ~/betrs
Windows users: You operating system might not have a programm for unpacking archives. In that case, install 7-Zip.
OR
Get the latest development tree via SVN from the repository:
svn co https://betrs.svn.sourceforge.net/svnroot/betrs/trunk ~/betrs
There is no installation procedure necessary. The topmost directory of the tree contains directories for different model incarnations. Currently there is only one, BETR-Global. All commands, scripts or interactive sessions should be run from this root-directory of the current model (here BETR-Global). In the following, pathnames are given relative to this directory.
Input Files
Note
For a standard BETR-Global run, ignore points 4–7 below
Chemicals/chemicals_default.txt is the database of chemicals. The file is self-documenting. Look up the ID (first column) of the chemical you want to model. In this example we will use PCB-118 with ID 11. This database of chemicals can be extended by adding more lines at the end. It is important that each chemical has a unique ID. You should not change chemical properties of substances in chemicals_default.txt. Instead, create a new chemical database with a different name.
Control/control_default.txt contains parameters affecting the model run. Currently there are two options:
aerosoldeg indicates whether chemicals sorbed to aerosols should be shielded from degradation processes (0) or not (1). Usually, “0” seems to be a good choice [GOETZ2008] .
dumpDmatrices indicates whether the matrices of D-values should be written to a file (1) or not (0). If 1, a list of 12 sparse 2016x2016 - matrices is written to Output/default/matrixdump.cpk in cPickle-format. Each matrix is the state matrix for one month of the year. Entries have the units [mol/h]. Rows and columns correspond to region/compartment combinations (cells) of the model. The matrix entry (ij) is the mass rate constant of transfer from cell j to cell i. The functions cell2regcomp() and tocell() can be used to translate rows and column indices into regions and compartments and vice versa.
Emissions/emissions_x.txt contain descriptions of the emissions. The files are self-descriptive. emissions_default.txt is an example for emissions that only occur in the first month, emissions_firstyear.txt an example for emissions occuring during the first year. Use these files as templates to create your own emission files with different (arbitrary) names.
Environment/const_parameters_default.txt and Environment/seasonal_parameters_default.txt contain temporally constant and seasonally changing environnmental parameters, respectively. The files are self-descriptive. They need not be changed for a standard BETR-Global run.
Flows/default/flowxy.txt contain flow-matrices for convective transport in transport media like air and water. x and y refer to the compartment IDs of the source and the target compartment, respectively. For example flow45.txt describes the flows from freshwater to ocean water, flow11.txt describes the flow in the upper atmosphere. The files are self-descriptive. They need not be changed for a standard BETR-Global run.
Environment/compartments_default.txt contains the compartment names and associates them with their ID and with certain environmental parameters. The file is self-descriptive. It need not be changed for a standard BETR-Global run.
Processes/processes_default.txt conatins a list of the processes to be considered. The file is self-descriptive. It need not be changed for a standard BETR-Global run.
Example session
The example session described here is already contained in the file testrun.py.
Open an IPython shell and cd into the BETR-Global root directory. Alternatively, you might want to use a different Python environment. For Emacs users we found the combination of ipython.el and python-mode.el particularly comfortable and powerful. There is a large number of Python IDEs available.
import numpy and the BETRS - module:
from numpy import *
from BETRS import *
Initialize a model with chemical 11 (PCB-118, see Chemicals/chemicals_default.txt):
m=Model(11)
It will take some seconds until the model has been built. There are optional parameters that can be passed to the init-routine of Model to choose a parameterizations different from the default (see BETRS.Model).
read emissions from emissions_default.txt:
m.update_emissions('emissions_default.txt')
solve for steady-state:
m.solve_ss()
To achieve a steady-state, the system matrix has to be time invariant. This is achieved by averaging the 12 monthly matrices of mass rate constants into one matrix that is representative for the whole year. The emission file for the steady-state in interpreted in a special way: Since emissions have to be constant, only the first column of emissions_default.txt is considered and interpreted as continuous emission of infinite duration.
Write the output of steady-state results as concentration and absolute mass:
m.output_ss(units=['mol_per_m3', 'kg'], netcdf=True)
This creates the files:
1. Output/default/ss_out.cpk contains a dictionary with keys 1–7, corresponding to the 7 compartments. Each value is again a directory with keys corresponding to the chosen units, in this case ‘mol_per_m3’ and ‘kg’. The content of this directory is a vector of steady-state data with 288 elements, correponding to the 288 regions of BETR-Global. Refer to output_ss() for a complete documentation.
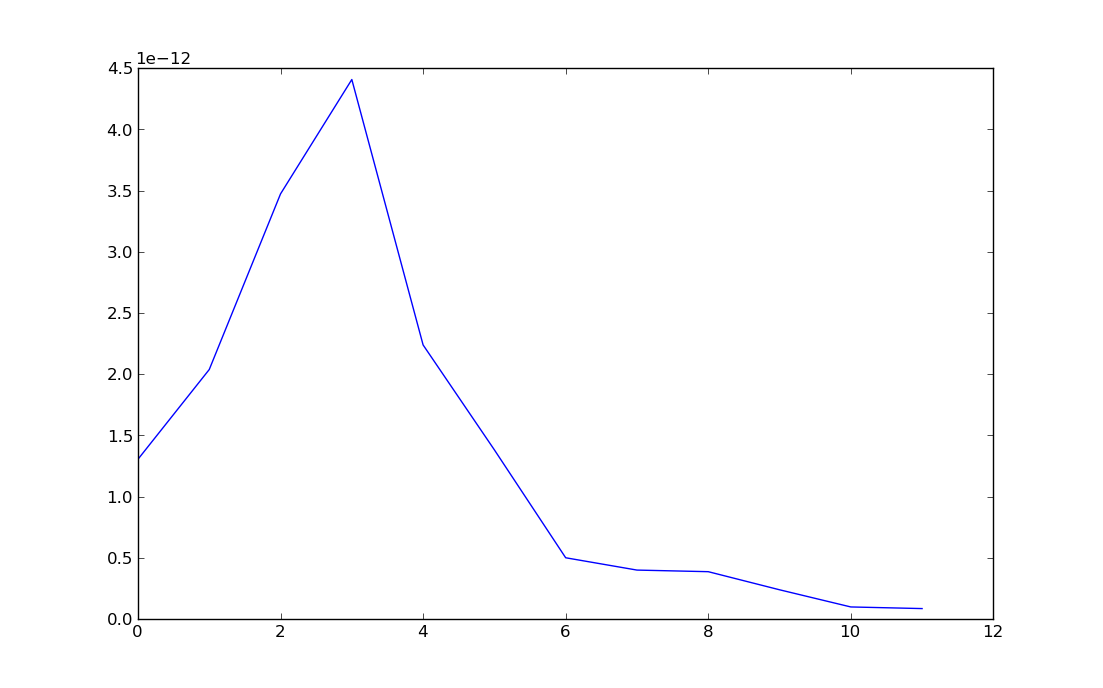
Data anaysis: If you want for example look at the latitudinal concentration distibution in lower air, do the following:
result=load('Output/default/ss_out.cpk')
c=result[2]['mol_per_m3']
cgrid=c.reshape(12,24)
clat=mean(cgrid, axis=1)
from pylab import *
plot(clat); show()
to get this graph:
There are methods to let you extract the whole averaged system matrix and the steady-state emission vector:
ssmat=m.get_avgMatrix()
ssem=m.get_ssEmission()
Now the overall peristence defined as residence time at steady is easily calculated:
Pov = sum(m.ss_res)/sum(ssem.toarray())/24
print("Overall persistence of %s:") % (m.chemdict['Name'])
print("%s days") % (Pov)
It is trivial to extract flow data, for example to look at the mass balance of soil (compartment 6) in region 158 (Africa):
## get full steady-state mass vector for flows from and to soil
soilflow_to=ssmat[tocell(158,6,m),:]*m.ss_res
soilflow_from=ssmat[:,tocell(158,6,m)]*m.ss_res[tocell(158,6,m)]

## flows from soil
happens=cell2regcomp(where(soilflow_to > 0 )[0],m)
print("Flows happens to soil to  compartments %s") %(happens[1])
print("in regions %s:") % (happens[0])
balance_to=soilflow_to[where(soilflow_to > 0 )[0]]
print(balance_to)

## flows to soil
happens=cell2regcomp(where(soilflow_from > 0 )[0],m)
print("Flows happens from soil to compartments %s") %(happens[1])
print("in regions %s:") % (happens[0])
balance_from=soilflow_from[where(soilflow_from > 0 )[0]]
print(balance_from)

## degradation
deg=sum(soilflow_from)

## print the total mass-balance
print("           ***** net balance ****")
balance=(soilflow_to-soilflow_from)[where(soilflow_from > 0 )[0]]
print("compatment: 2           3           4")
print("          "+str(balance))
print("degradation loss: %s") % (deg)
and produce a bar-plot:
import pylab
pos=array([0,1,2,3])
posc=pos+0.4
fig=barh(pos,height=0.8,width=insert(balance,0,deg))
yticks(posc,('degradation','air','vegetation','freshwater'))
show()

To solve the model with transient emissions, let’s first load a different emission scenario that has emissions during the whole first year after which emissions are shut off:
m.update_emissions('emissions_firstyear.txt')
Then update (initialize) the solver, solve for 5 years and write the output:
m.update_solver()
m.solve_dyn(5)
m.output_dyn(units=['mol','mol_per_m3','kg','Pa'],netcdf=True)
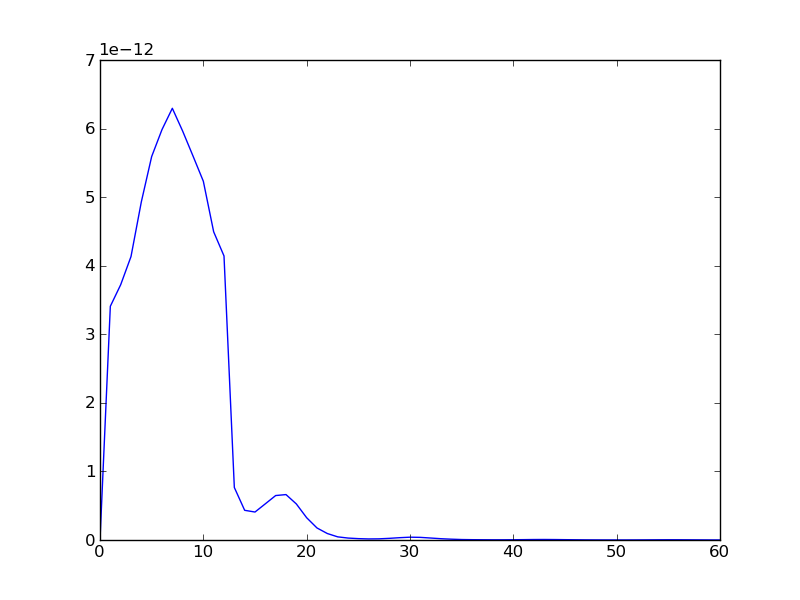
Load the result and plot the timeseries of concentrations in Northern European (region 38) lower air (compartment 2):
dynresult=load('Output/default/dyn_out.cpk')
plot(dynresult[2]['mol_per_m3'][37,:])
Note that the array index corresponding to region 38 is 37, because Numpy-array indices start with zero.
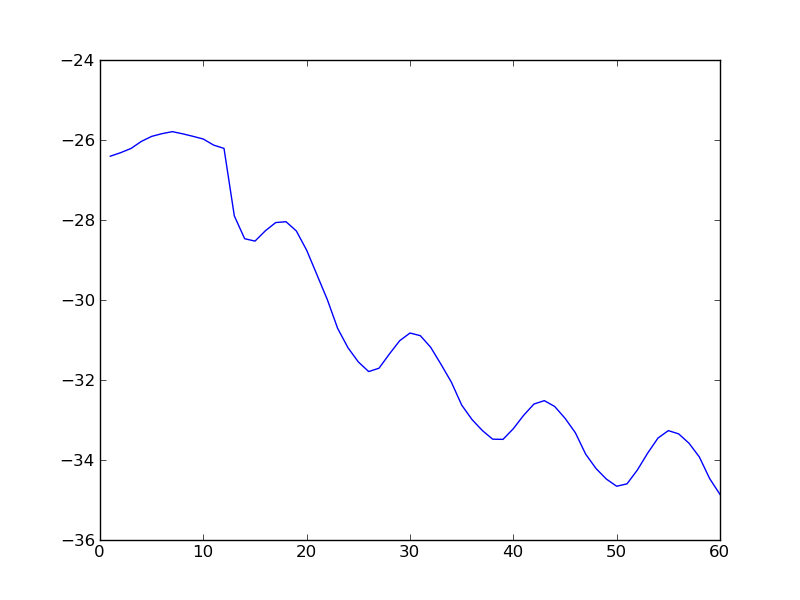
Compare that to a plot on the log-scale:
plot(log(dynresult[2]['mol_per_m3'][37,:]))
Refer to the source code for more details.